tl;dr:
Fake news complains do not have an impact on the market. It is very difficult to predict the stock market just from Trump tweet's sentiment.Summary:
In this article we will cover:
- Visualize S&P index movement and volume traded
- Visualize key words in Trump's tweets.
- Trump's mood by the hour of the day.
- Plot all Trump's tweet along with S&P index
- All the code to generate plots can be found on Github
We will not cover here: (refer details on Github link above)
- How the Tweets are scraped.
- How the S&P index daily prices are scraped.
- How Valder Sentiment Analysis works, exactly.
- Provide an actual prediction on stock market performance in real time.
It is no secret that President Trump likes to tweets his feelings or policies on domestic and foreign affairs. Some of them are powerful enough to trigger an immediate movement on Company's stock prices.
Boeing is building a brand new 747 Air Force One for future presidents, but costs are out of control, more than $4 billion. Cancel order!
— Donald J. Trump (@realDonaldTrump) December 6, 2016
temporarily after this tweet.
So the big questions that we should ask:
Although no one answered (publicly, some may have a perfect model and never revealed its secret) the second question, the first question can be answered with some confidence using VADER Sentiment Analysis and is widely used in academic settings.
Twitter Sentiment Analysis is a process to compute the attitude of a tweet being positive, negative or neutral using natural language processing techniques.
Regards to marketing, companies can use the technique to understand customer's response towards a product, brand or campaign, and decide further actions to acquire more users. During elections, it can be used to track political view and predict election outcomes.
There are some online articles to analyze President Trump's tweets, few, however, connect the results to the stock market performance. In this project, we aim to go through Trump's tweets from Jan-01-2017 to May-16-2018, extract insightful information and visualize them with the S&P 500 (The Standard & Poor's 500, is an American stock market index based on the market capitalizations of 500 large companies having common stock listed on the NYSE or NASDAQ) movement during the same period.
RECORD HIGH FOR S & P 500!
— Donald J. Trump (@realDonaldTrump) September 29, 2017
S&P index, what about it?
The S&P index went up from about 2250 in Jan 2017 to around 2870 in January 2018. The stock market became much wild since February: the fear for inflation in early February, the Facebook data privacy scandal over Cambridge Analytica's data usage during the election and the potential trade war between China and the United States all contributed the volatilities in the market. (feel free to play with the slider in the interactive plot below and hover on the different date)
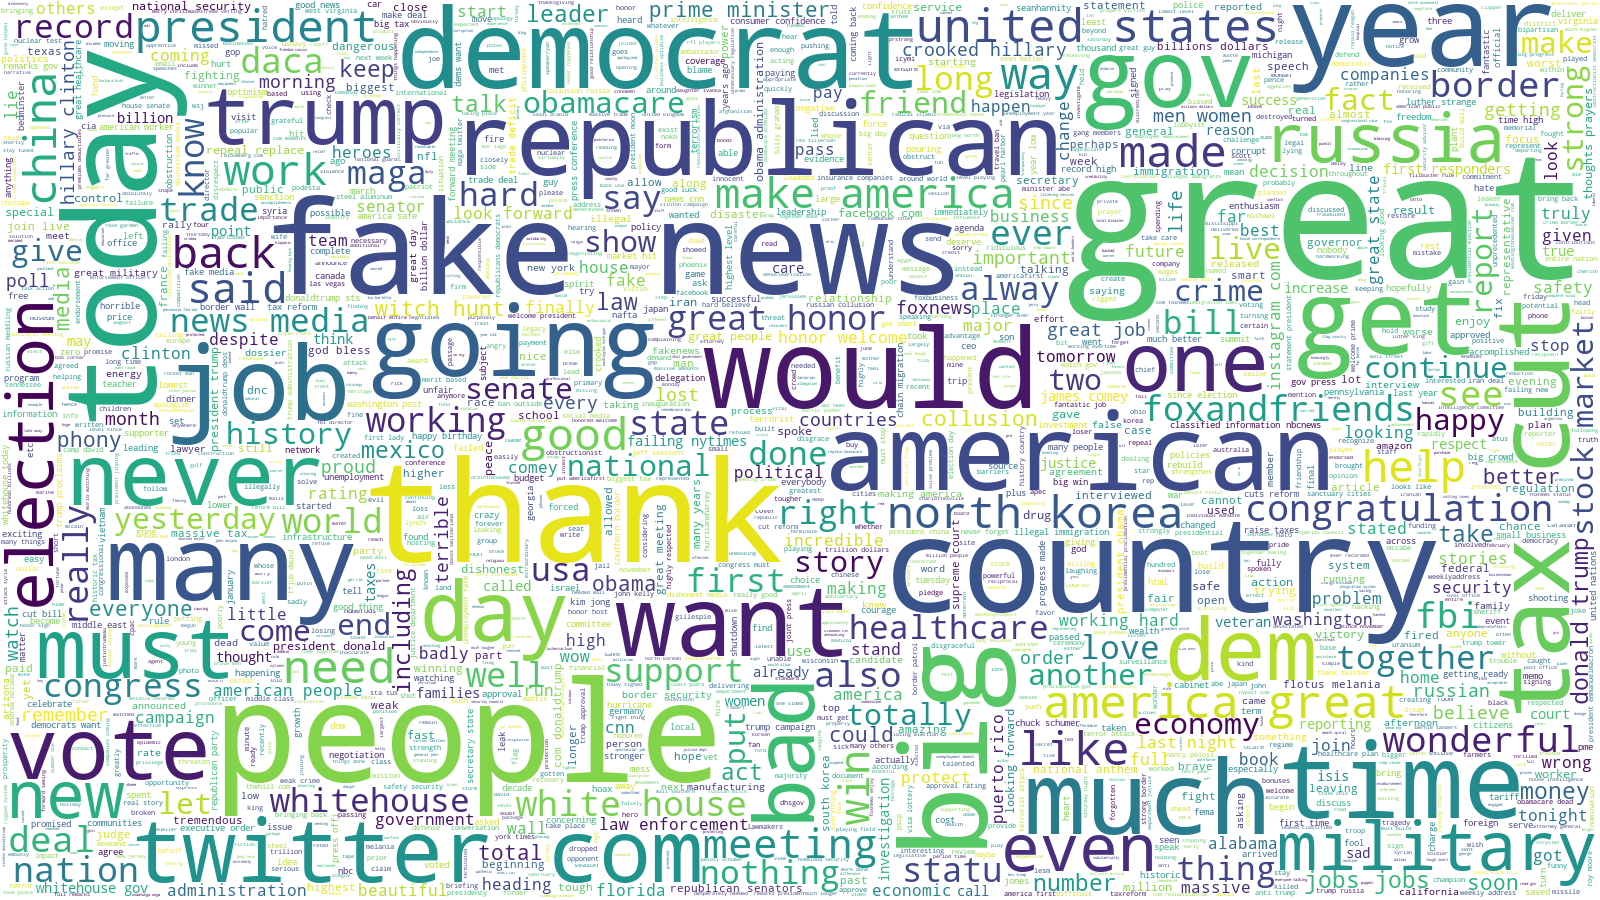
Do Trump's Tweets have anything to do with it? Let's take a closer look what are the frequently used terms that are used by President Trump.
Perhaps it's better to separate negative and positive tweets and visualize the word cloud individually:
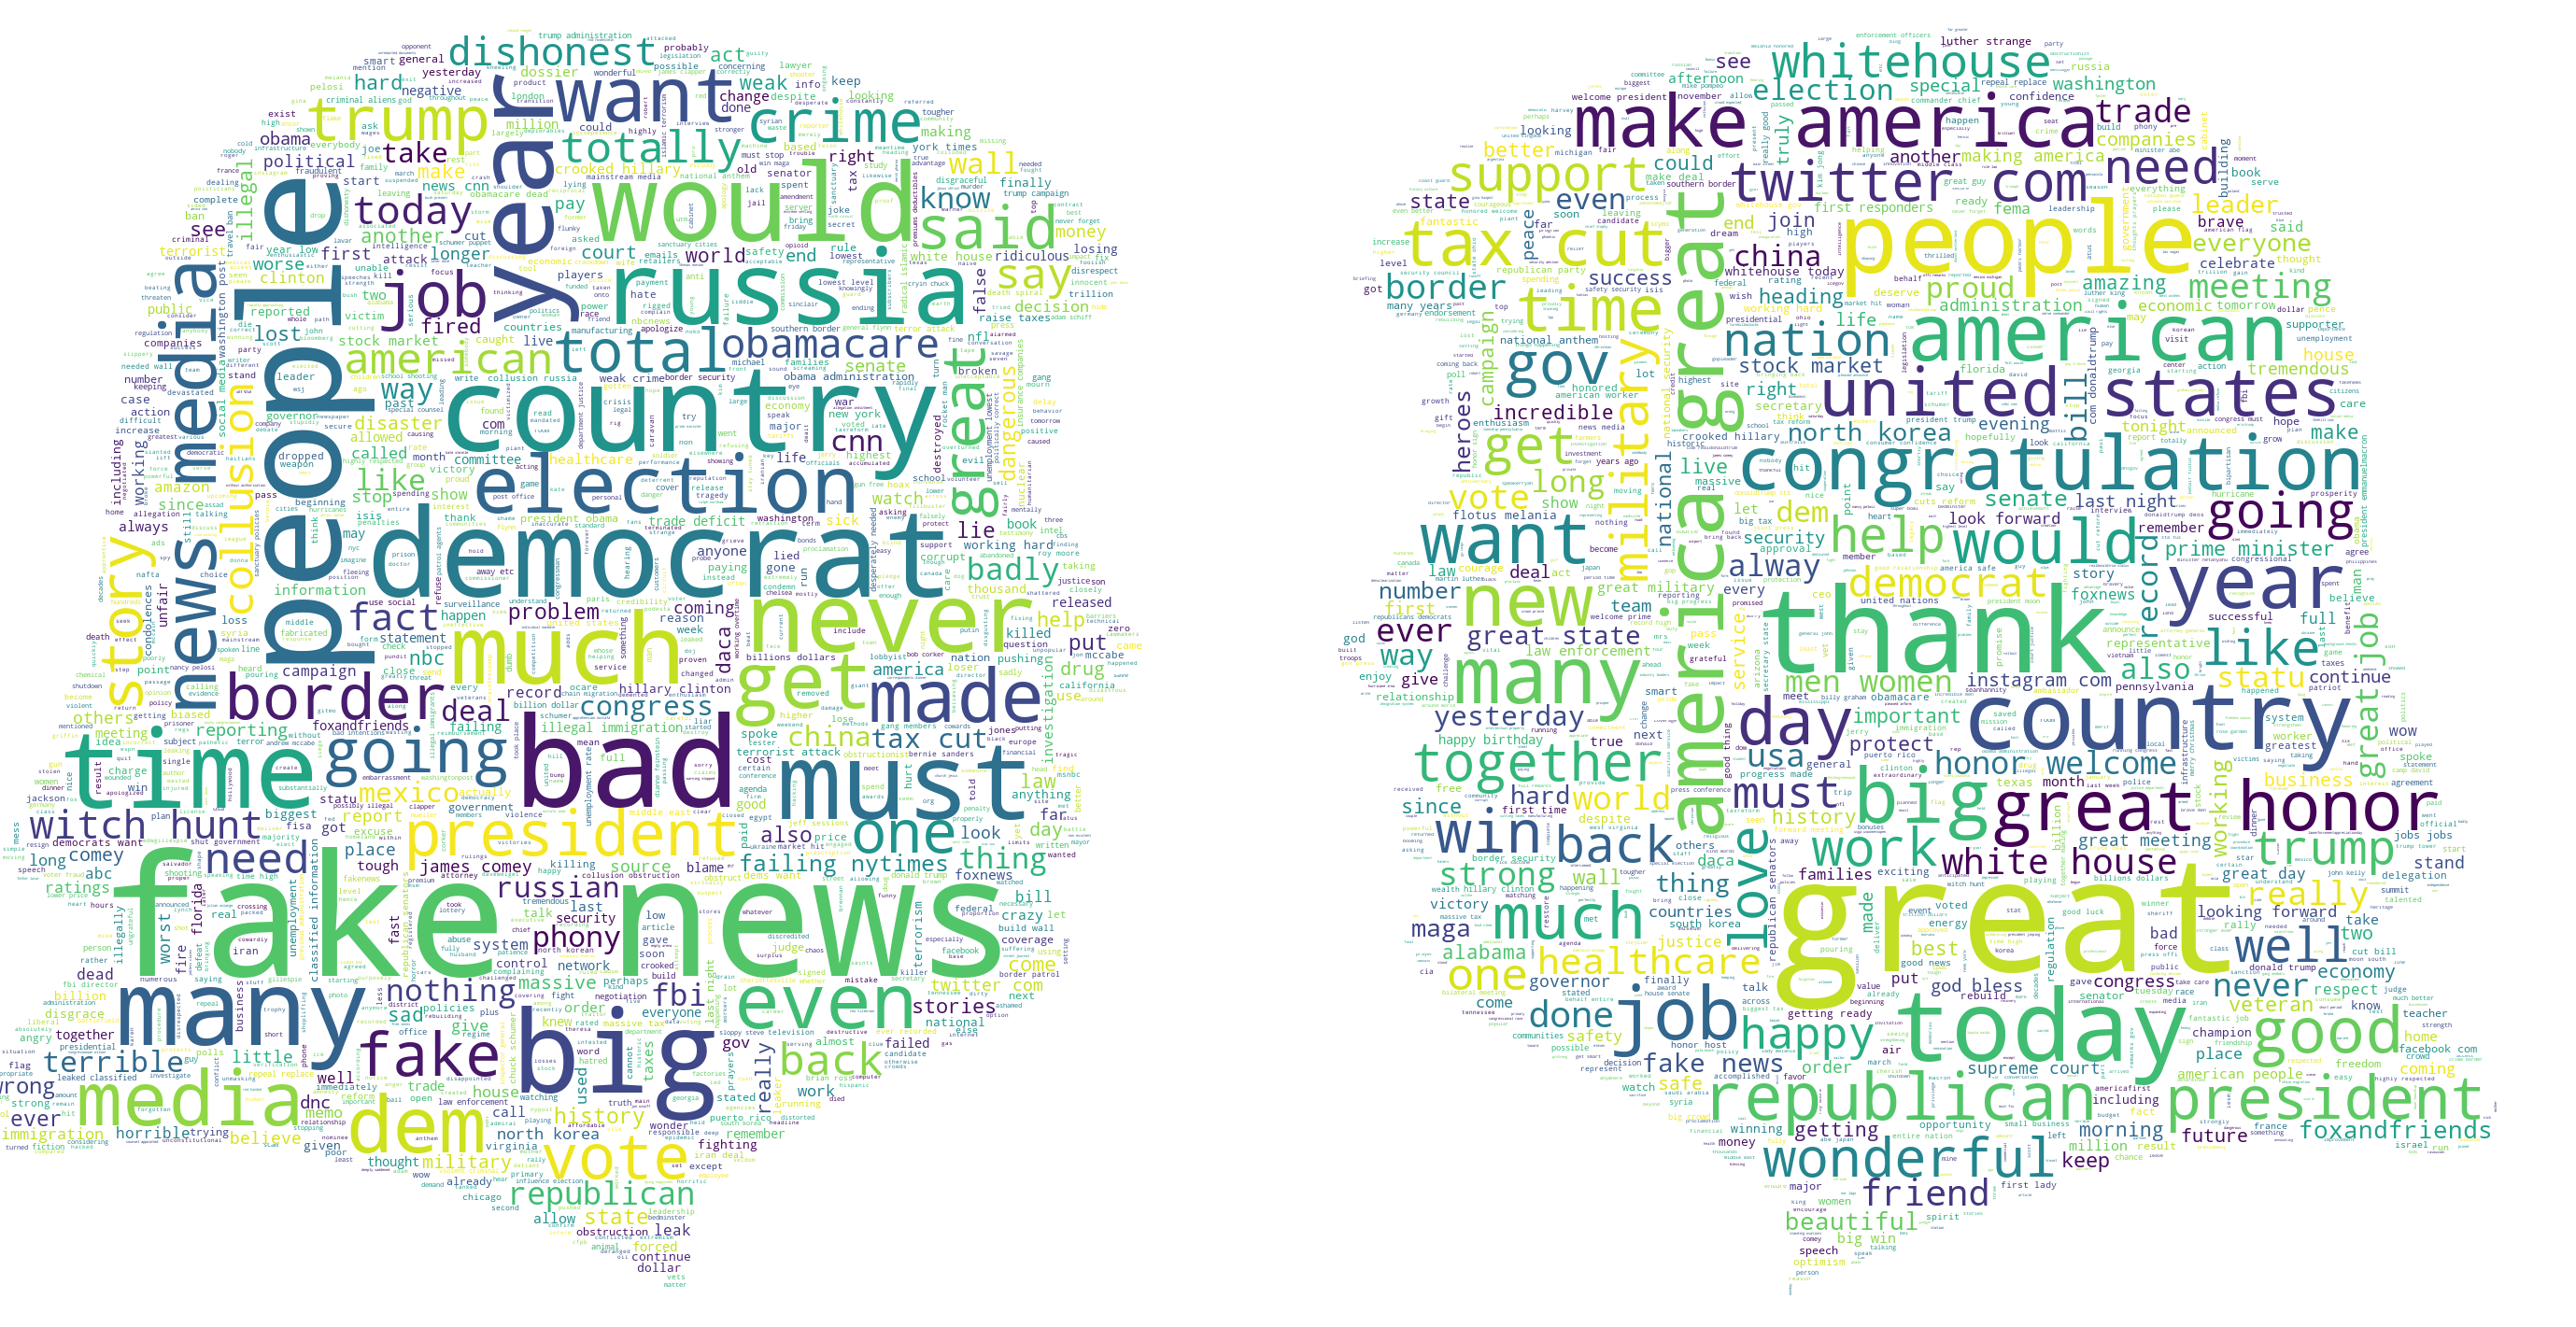
No big suprise that we see terms like fake news, media used frequently in negative and thank, make america , great , tax cut used frequently in positive tweets.
What time of the day is Trump happy?
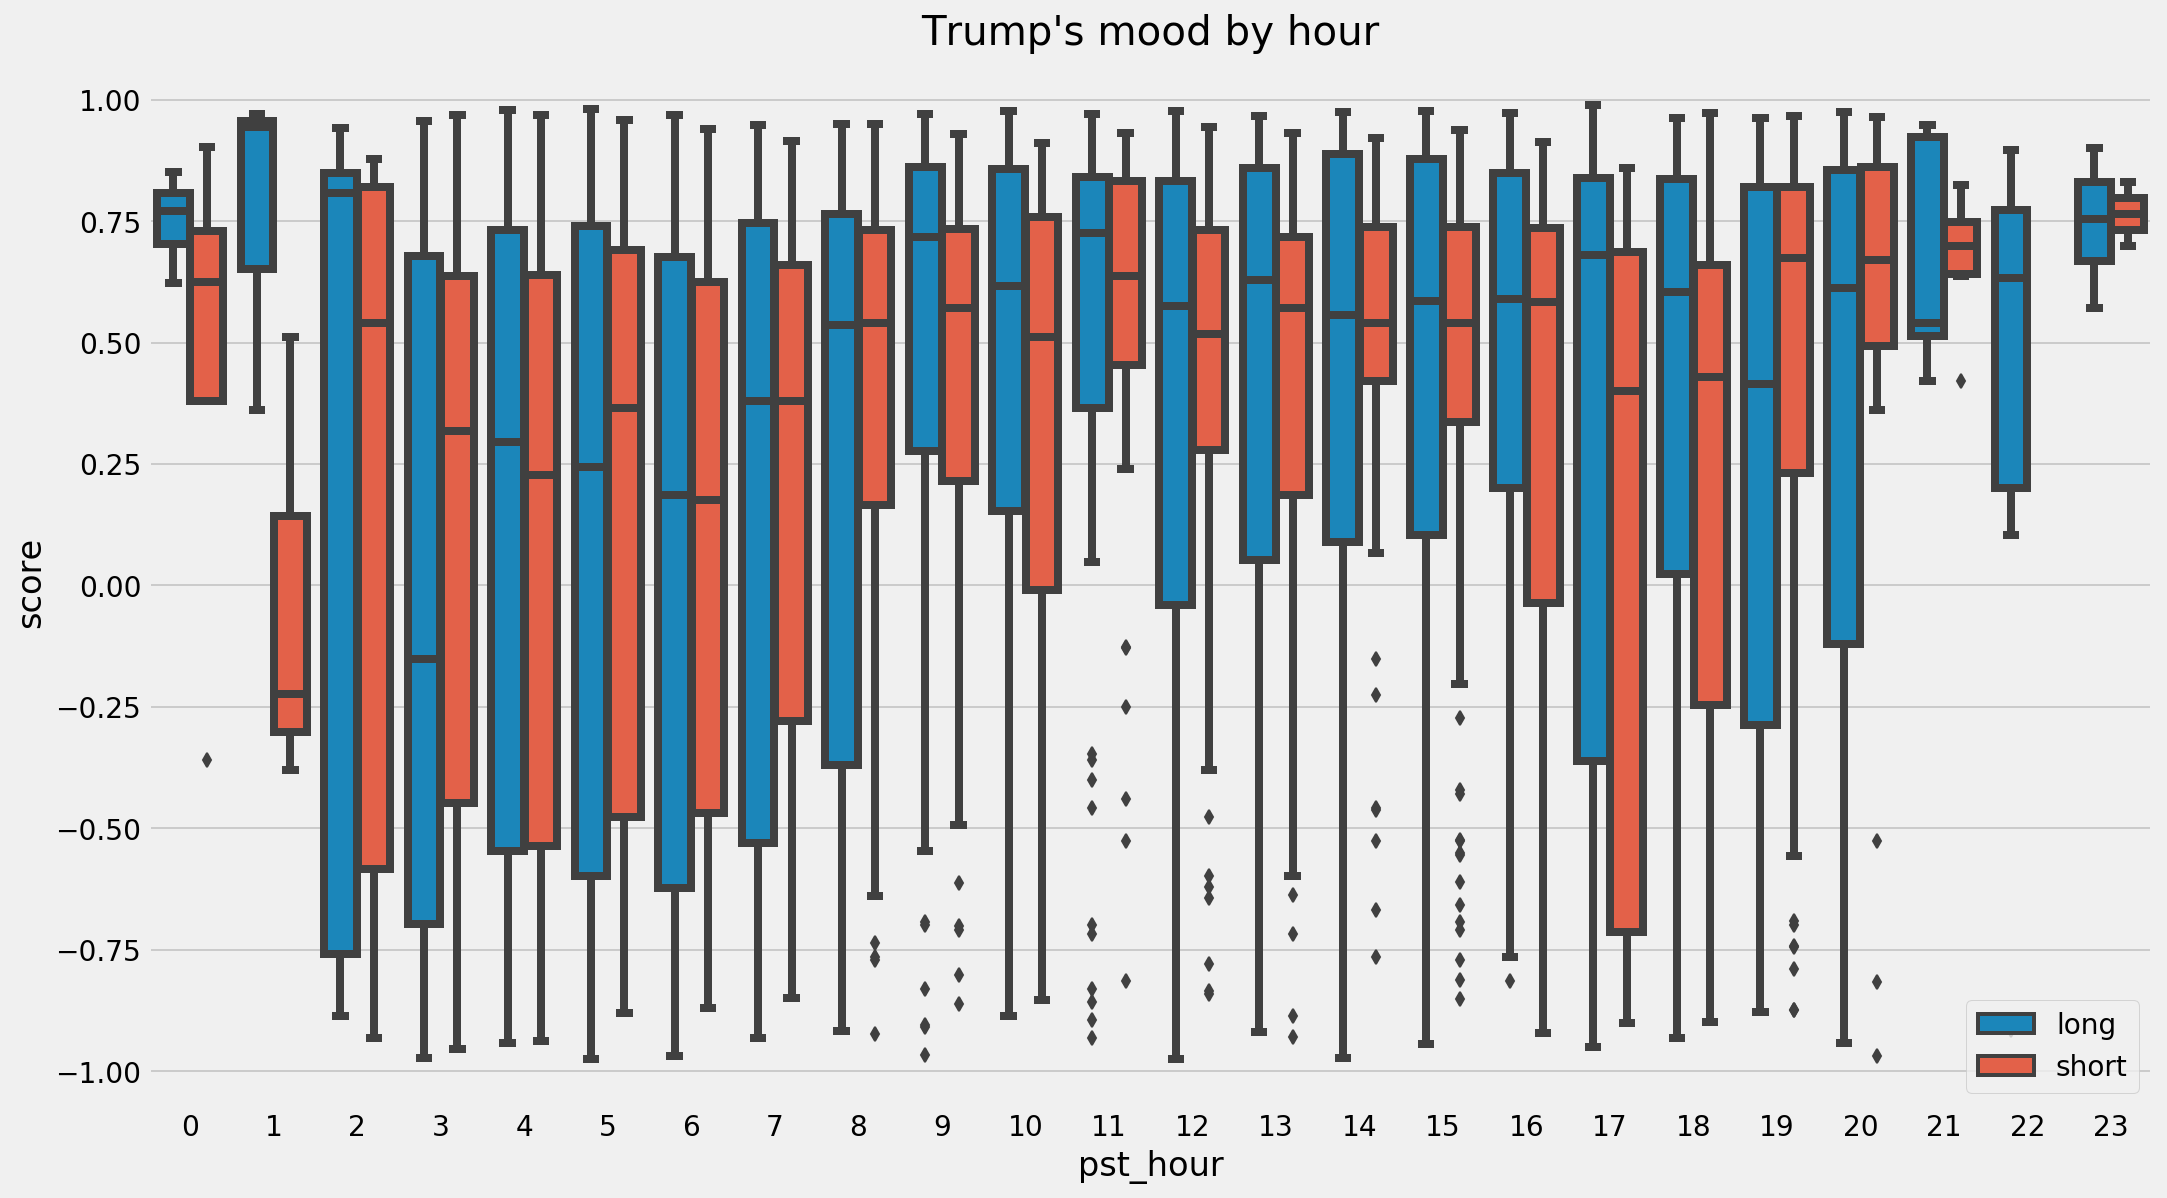
Observing the box plot above, one can reach a conclusion that Trump is positive during Working hours and is a little grumpy before and after work. Maybe expressing negativity on Twitter is a way to fight pressure from running the country!
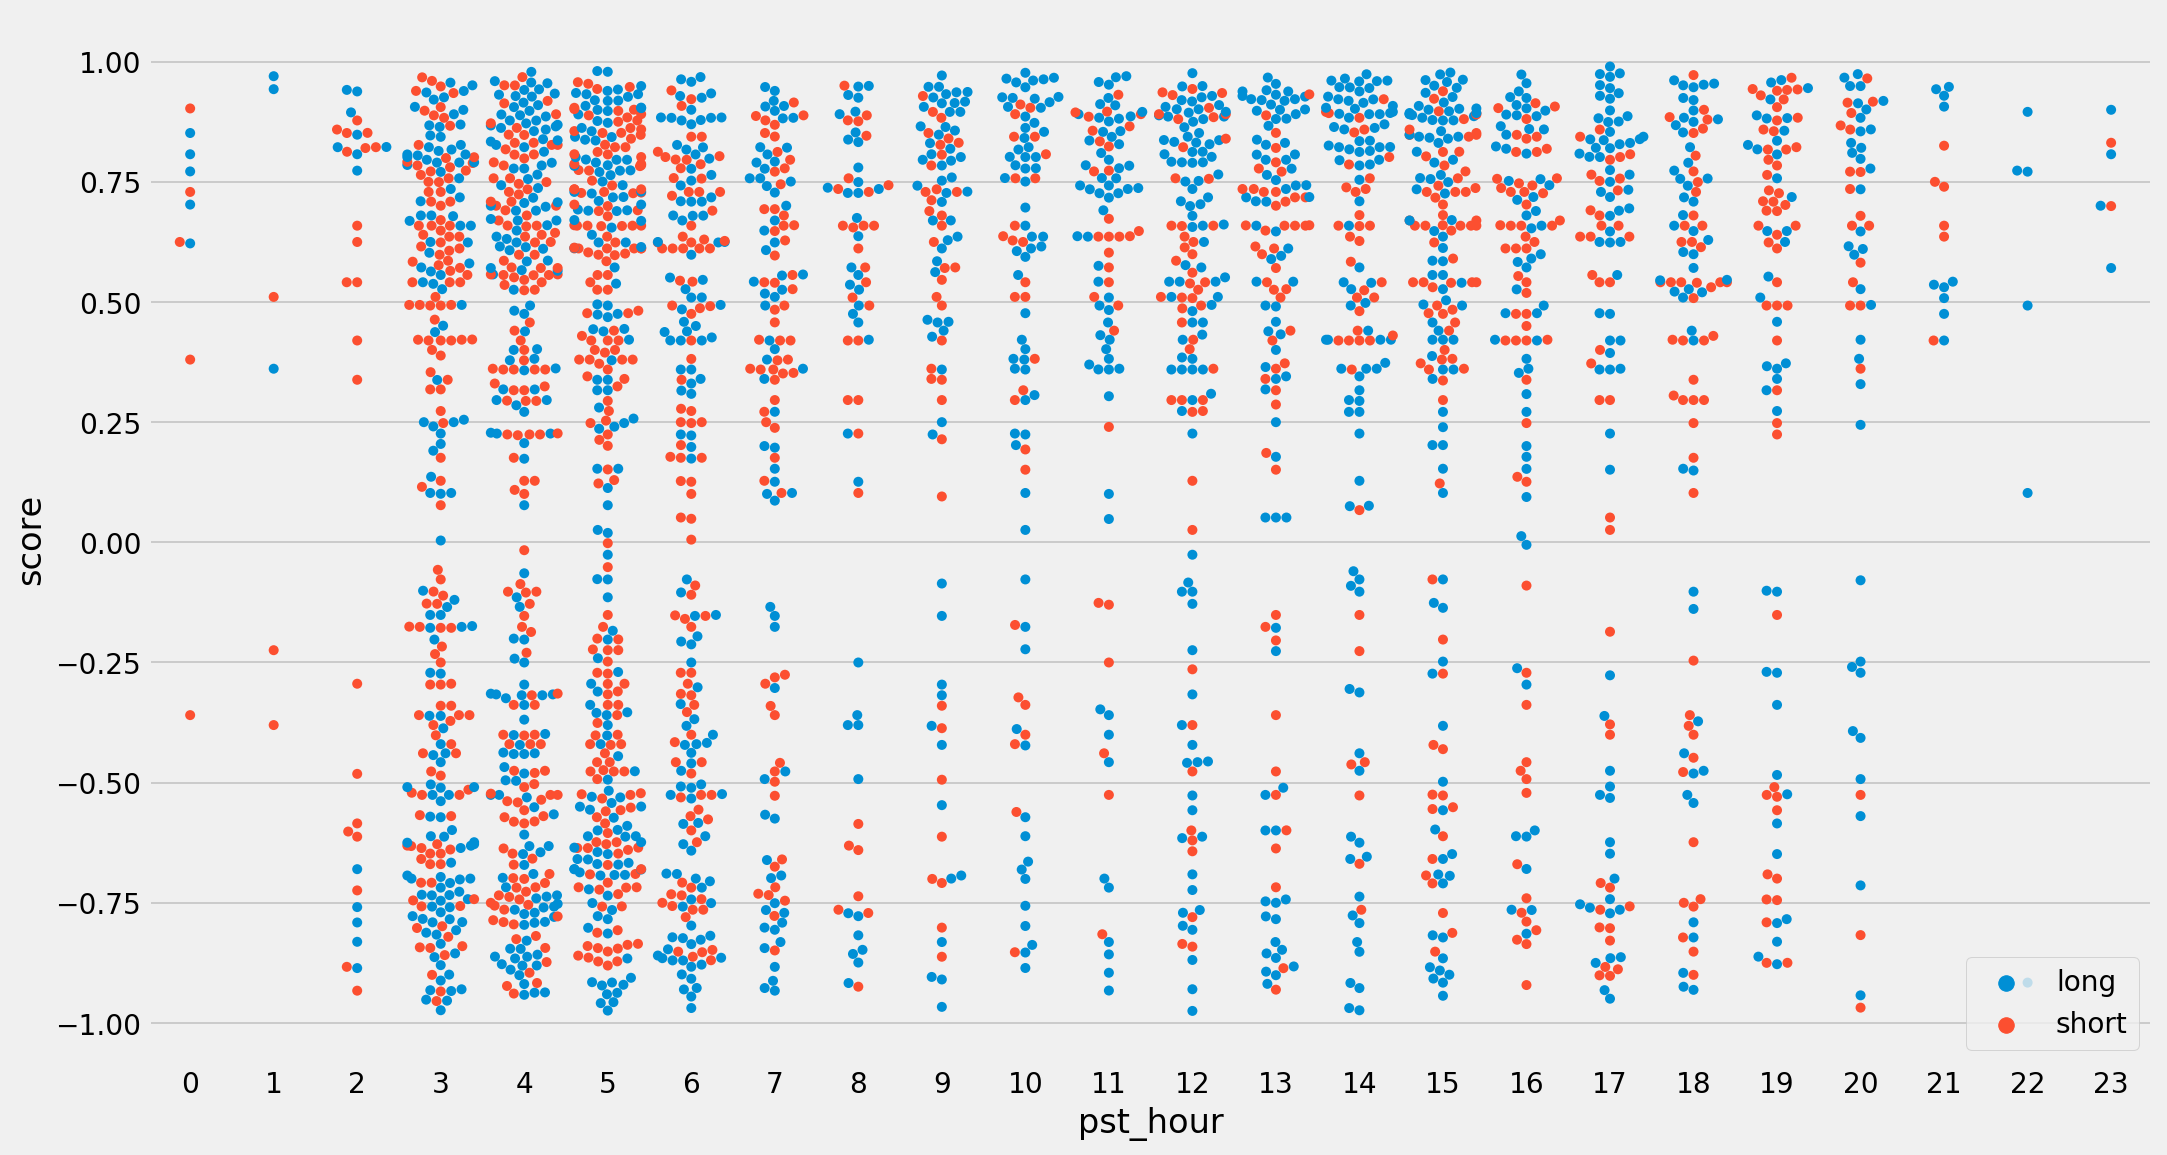
A swamp plot shows that a lots of Tweets (both positive and negative ones) were tweeted before 9am Eastern Standard Time, most tweets from 3pm to 7pm are quite positive.
Visualize all Trump's tweets with S&P 500 index
Here we present all Trump's Tweets as well as the S&P 500 index movement.Click on the legend to hide some lines. Move the slide bar to focus on certain days will make it easier to find tweets. For example, you could find the following tweet on Apr 4th, 2018:
We are not in a trade war with China, that war was lost many years ago by the foolish, or incompetent, people who represented the U.S. Now we have a Trade Deficit of $500 Billion a year, with Intellectual Property Theft of another $300 Billion. We cannot let this continue!
— Donald J. Trump (@realDonaldTrump) April 4, 2018
Conclusion: After randomly browsing tweets, we could gain some insights from the plot above: the Valder Sentiment Analysis does a good job at measuring the sentiment of a tweet. President Trump has changed his style to disclose information since the Boeing tweet therefore Trump's Tweet should not be treated as the first source to predict the next stock market movement. The daily sentiment score average also has almost zero correlation with S&P 500 return on the same day.
Future Work:
- Use LDA (Latent Dirichlet allocation) model to select tweets that relate to economics only (e.g. no complaints about fake news involved).
- Focus on individual companies. e.g. How Trump's tweet on USPS delivery charges impact Amazon's stock price.
- Look deeper into sentiment analysis method: Trump being positive might not be a positive signal for the stock market or an individual stock.