tl;dr:
Using Weather and GPS data, one can accurately estimate the duration time for each bike trip. The total number of trips in each day can also be predicted using temperature and the weather. Overall, human behavior, in a way, is very predictable.Summary:
In this article we will cover:
- Introduction to the project.
- Analytical Results.
- Outline the process to clean and organize the data.
- Understand the data by exploratory data analysis (EDA).
- Some Feature Engineering.
- Potential future work.
- All the technical details can be found in notebooks on Github.
New York City’s Citi Bike, has one of the largest bike shares system in the western world (China has a different story: by 2017, ofo and mobike have more than 1-million bikes in first-tier cities). It seems that more New Yorkers enjoy more and more using Citi Bike to commute these days: the number of bike trips increased over 60% over the past two years to a nearly 17 million trips in 2017. The number of bike stations almost doubled from 493 to 869.
As a data scientist, I asked myself: what information can I gain from the data? Can I predict how long the trip is if I know where the bikers are going? Can I predict the total number of trips on a given day? The answer is YES.
One can predict the total number of daily trips really well and ahead of time (if one can predict the weather perfectly). I use data from January to October as the training set and use the data from November and December as the validation set. You could tell that the model works really well (for holiday seasons as well) even trained with less than one-year of data. For individual trip durations, the LightGBM model with some tuning can predict more than 75% trips with less than 30% errors.
The Data and how it is cleaned
Many data scientists believe that 80% of the data science works lie in data cleaning and organizing, properly cleaned and organized data set will improve the performance significantly. This section will explain where the data came from and explain (on a very high level) how the cleaning process works. All the bike data from 2013 up to one month ago can be found here, each CSV file contains monthly bike trips in both NYC and Jersey City. With some tweaks one can read all CSV files into a pandas dataframe:
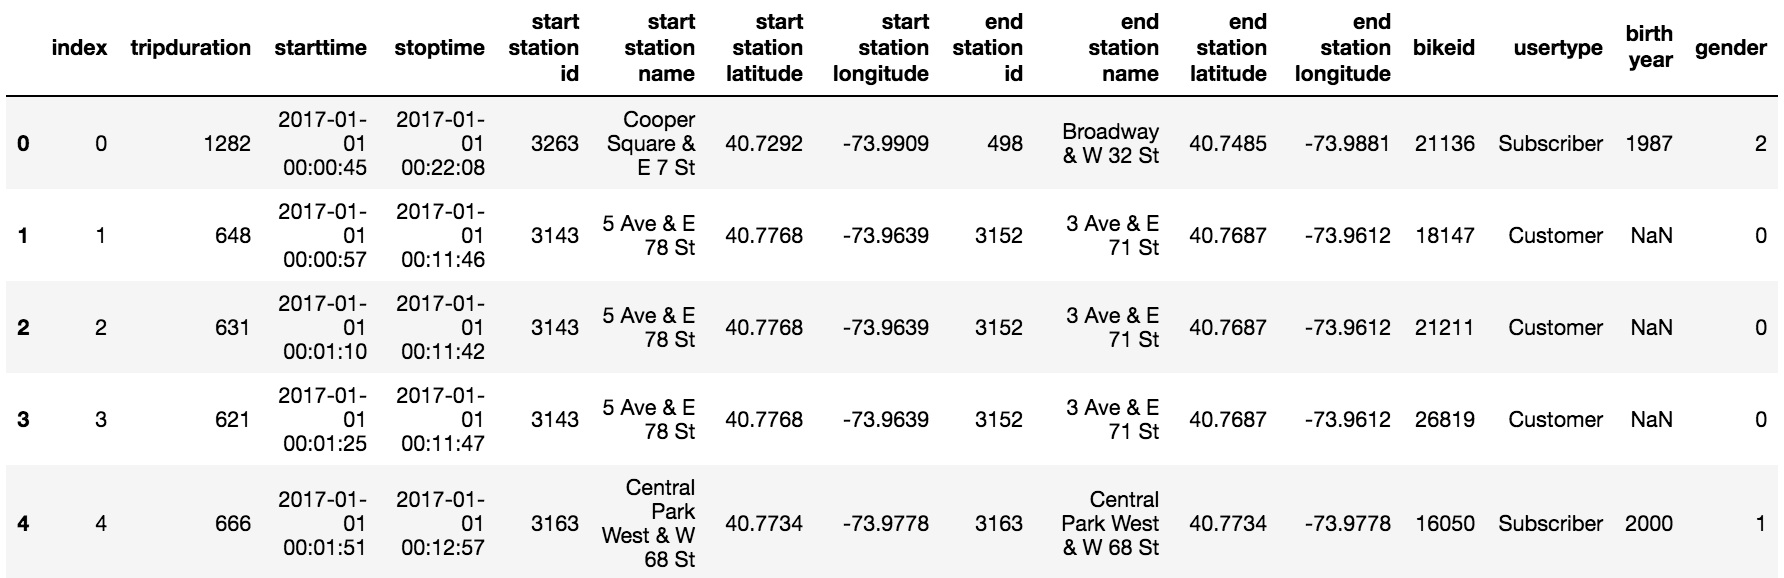
To summarize:I remove all trips longer than 3600 seconds. Remove all trips end up in the same pickup location. Remove all trips came from or to special stations (repair center etc). Save station id and latitude, longitude as a dictionary to save nearly 2/3 of the space. Impute missing values for user type and user age. Merge with weather data such as max, min, average temperature, precipitation etc. Approximate trip distance by calculating Manhattan distance between two stations using GPS data.
Again, I will not go into the technical details here, feel free to visit the Github for more details.
EDA
There are a number of interesting facts about Citi Bikes. I will try to highlight the important ones: The number of trips ratio between customers (non-regular) and subscribers is about 1:10 (Although two groups of customers are fundamentally different in terms of biking behaviors, I decided not to build two separate models just for 10% of the population). Most rides are finished within 20 minutes. Most rides take place during rush hours. There are a lot more trips during weekdays than weekends. The weather and temperature affect the total number of daily trips by a lot. On average, the speed of bike trips is above 3.5 mph. The correlation coefficient between the temperature and total daily trips is about 0.77 showing a really close relationship.
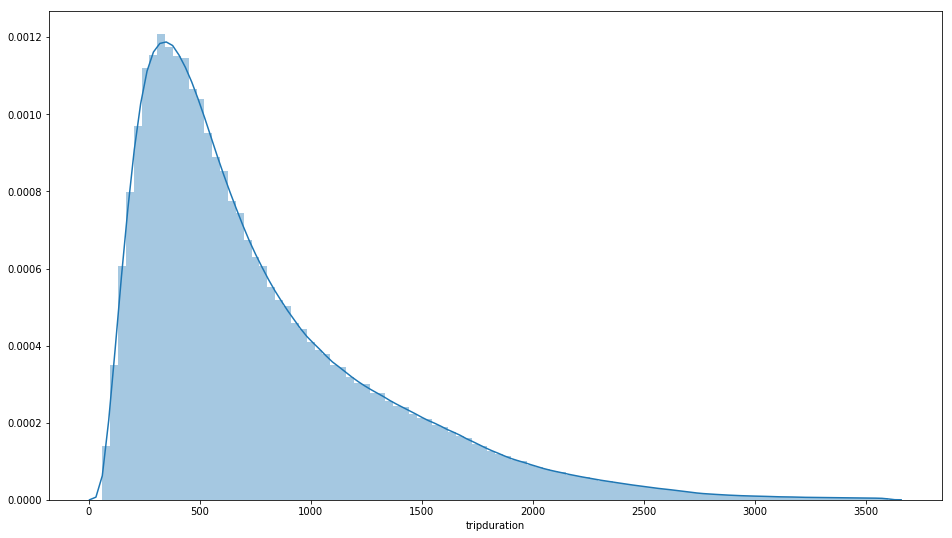
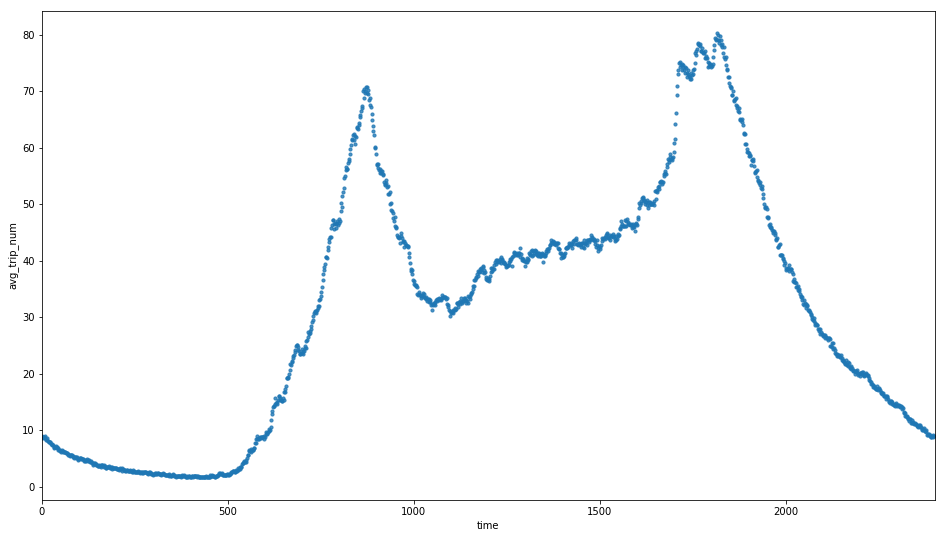
Fig 3. Many trips finished within 10 minutes; Trips peaked at 8:30 AM and 5:30 PM.
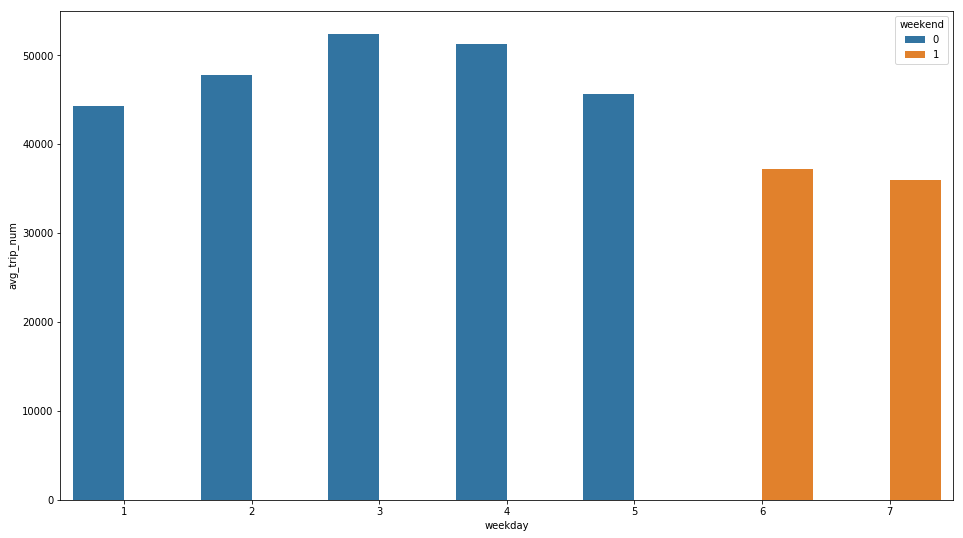
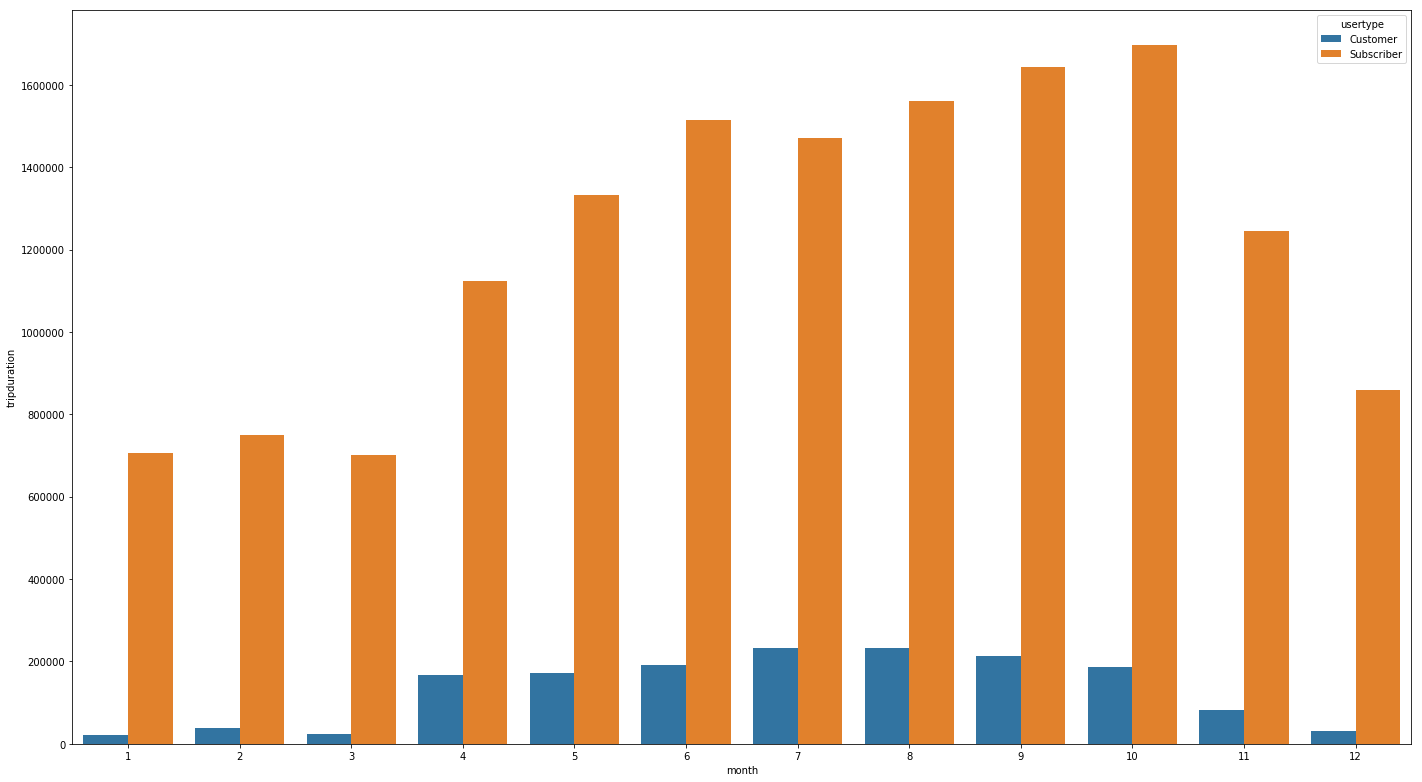
Fig 4. People ride less on weekends; Commuters like to bike from May to October.
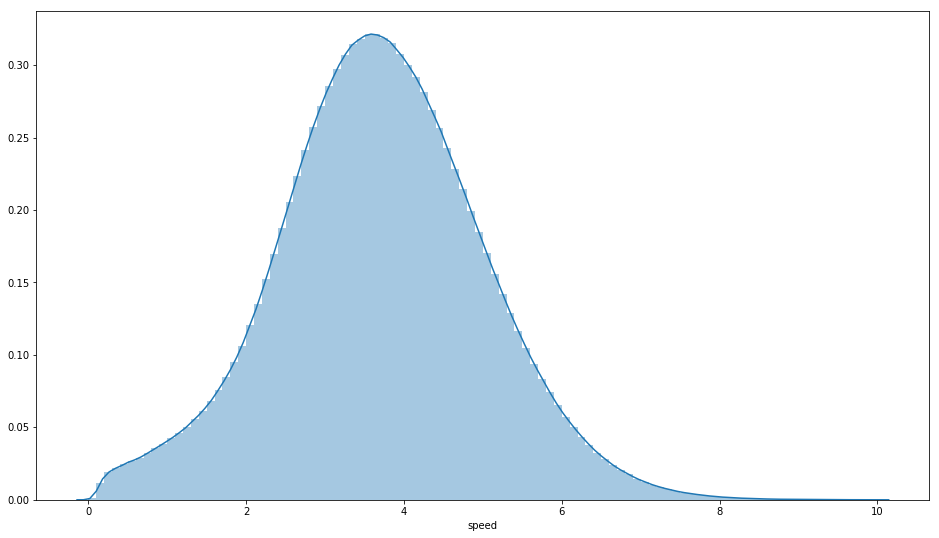
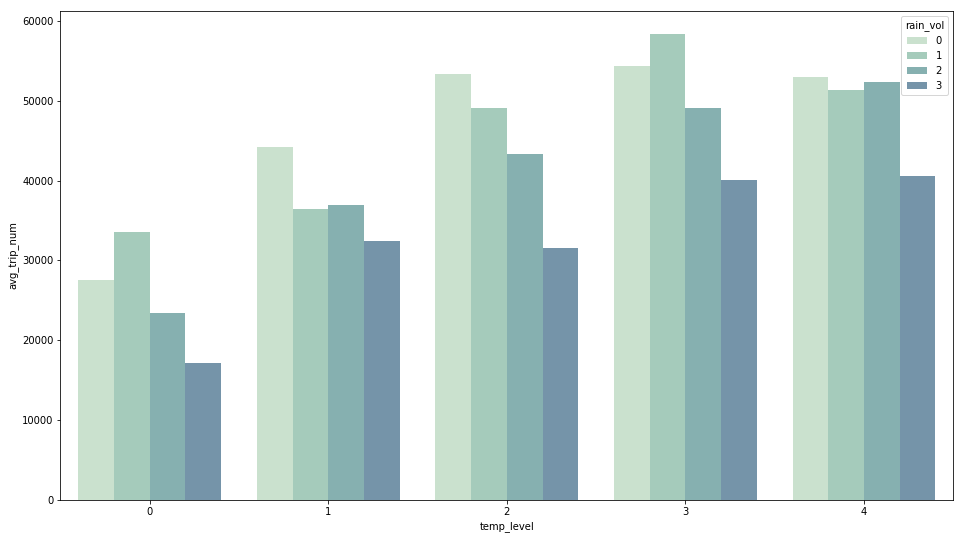
Fig 5. Speed is roughly normally distributed; Riders prefer sunny days over heavy rains.
neighborhood every half-hour
From the annotation one can tell that there are some clusters are always busy. The peak hours see a lot of traffic towards Grand Central Terminal and Wall Street.
One can see that snow and heavy rains reduce the number of trips significantly. Also, the temperature and number of trips are highly correlated.
Feature Engineering
The most important feature of our model to predict individual trip durations is the estimated distance between two stations. This is intuitive since longer trips usually take longer time. I also used a technique called regularized target encoding in this project to improve the model performance.
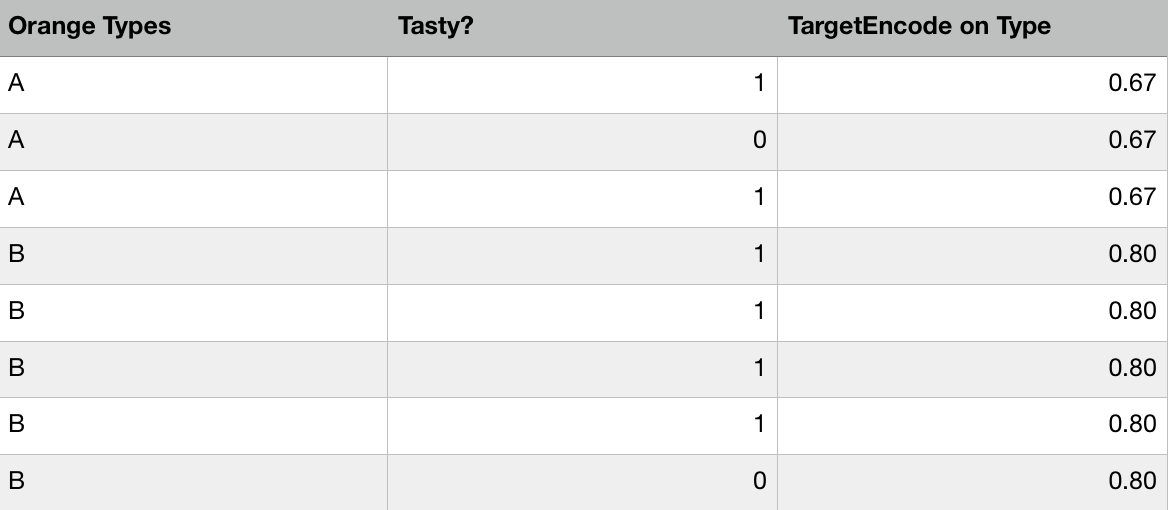
Target encoding basically map categorical variables into the mean (some also include variance or standard deviation) of the response variable (i.e. target variable). This approach improves the performance significantly especially when the response variable is loosely normally distributed.
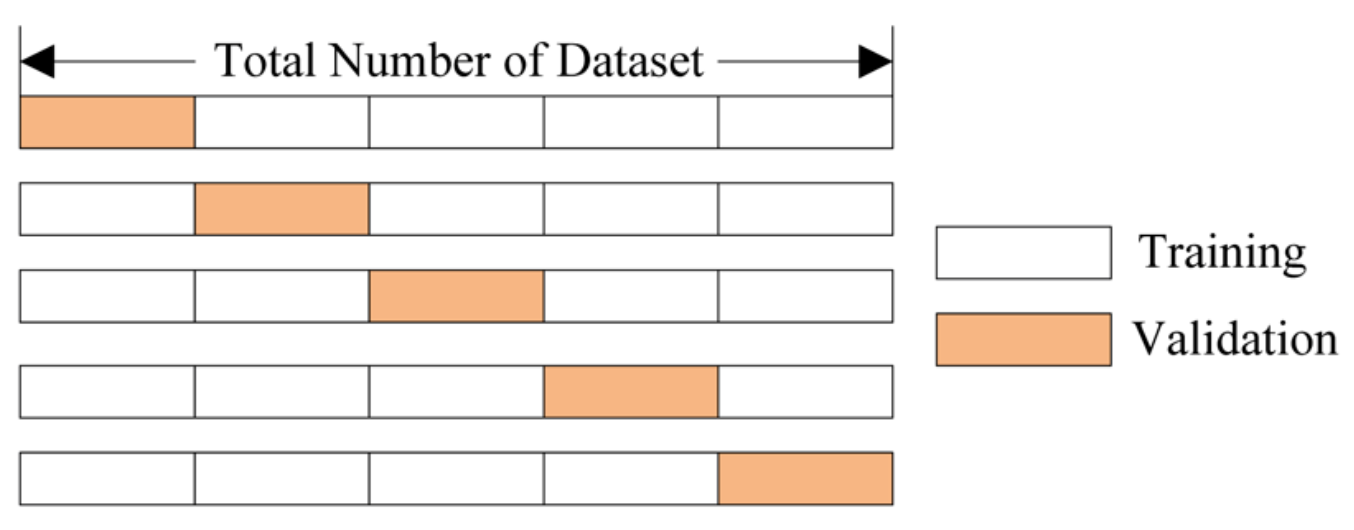
Regularized means that the encoding is calculated based on the average of cross-validations results thus the overfitting issue is greatly reduced.
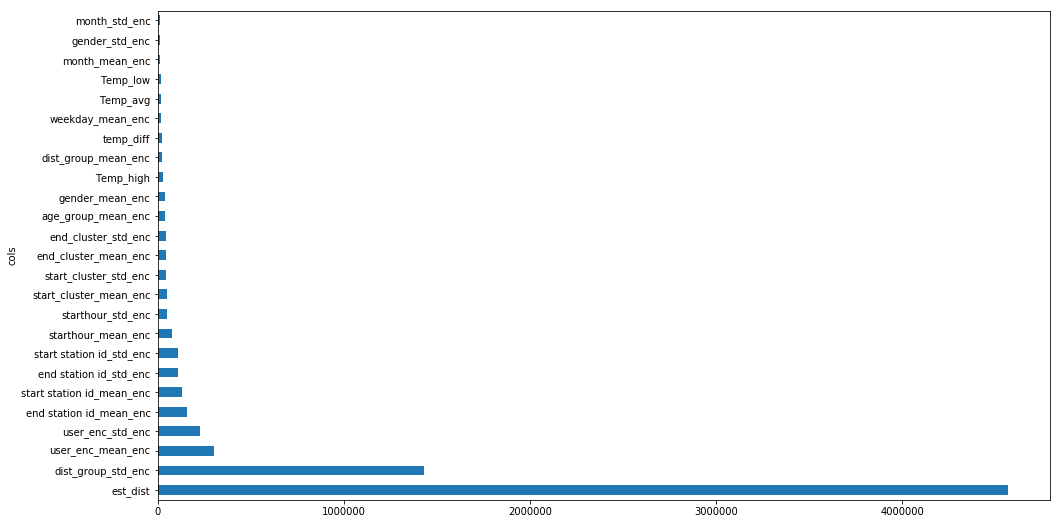
The final model was trained on LightGBM model (much faster than XGBoost and feasible to train on personal laptops) with 16.1 million trips and more than 40 features, model parameters were tuned based on validation set (20% of randomly chosen from the data). The important features include the estimated distance between two stations, user type(Regular or One-time-user), where the trip starts/end. A little surprised that weather did not affect a lot to the trip duration.
Future Work
As mentioned in the begining of the article, the result shows that prediction for both invidual trip durations and total number of daily trips are decent. Future work could invovle getting NYC taxi, UBER data and verify if UBER makes traffic better; a project to compare speed for Citi Bikes vs. UBER might also be interesting.